Insurance tech
Risk analysis for underwriters
Overview
This project stemmed from client feedback on risk assessment in Quest Marine. I worked closely with clients and the marine product team to identify user needs and pain points. My role involved validating the problem and collaborating with a cross-functional team to develop solutions, while continuously engaging clients to test and refine our ideas.
The problem
Risk assessment is central to our product and a key differentiator for clients. Quest Marine stands out by integrating behavioral vessel data, beyond standard physical characteristics, into risk evaluations and factors.
This project was driven by user feedback pointing to challenges in understanding behavioral risk factors, especially their impact on underwriting fleets and negotiating with brokers.
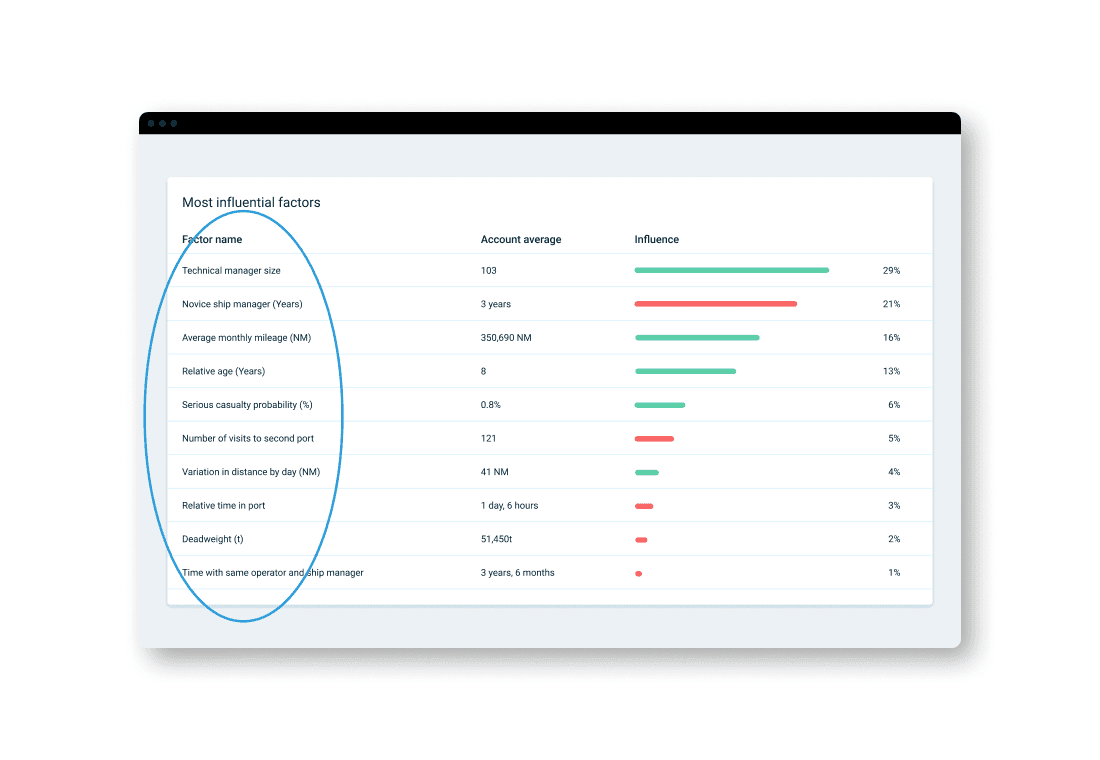
As the screenshot of our initial feature shows, many behavioral indicators lack clear links to risk outcomes, making them difficult to interpret on their own.
Process
My approach
The first step was to talk to our clients and users to gather their feedback. This led to working with the customer success team to arrange face-to-face interviews, workshops, and product sessions with our clients. As this was a key feature for our clients, it was important to dig into what their key issues and pain points are.
Agree on a plan to arrange sessions with key clients and users to gather feedback.
Working with the product team we grouped the feedback into themes to highlight pain points and areas of improvement.
Using the findings, I would begin to create wireframes and mock-ups, which I would review internally with the product team and a working group of subject matter experts.
Once I had narrowed down the list of solutions, I tested them with our clients and users. It was critical to ensure our users were happy and in alignment with our direction before we committed any resources to development.
Research
The primary method of research I conducted was user interviews. We gathered key insights into their expectations, workflows, and pain points. The main takeaways from this round of research include:
Underwriters struggle to identify risky trends due to the wide variability of contributing factors.
Simplicity is critical: “Our underwriters don’t need all the details, just enough to assess what’s good or bad about an account or vessel.”
Greater context is needed to clarify how specific factors influence risk, as many are difficult to interpret in isolation.

Ideation
With a clear direction informed by research and the key findings, I began developing wireframes through an iterative process. This involved close collaboration with the Product Manager, internal subject matter experts, and our marine working group (consisting of industry experts) for ongoing feedback. Continuous validation and testing are integral to my design process to ensure solutions effectively address user needs.

Testing
Based on internal reviews of my wireframes, it was decided to take some of the preferred ideas and turn them into higher fidelity mock-ups to test with our clients. Here are a few examples I presented to our clients along with a summary of the feedback that I gathered from those sessions.


Final design
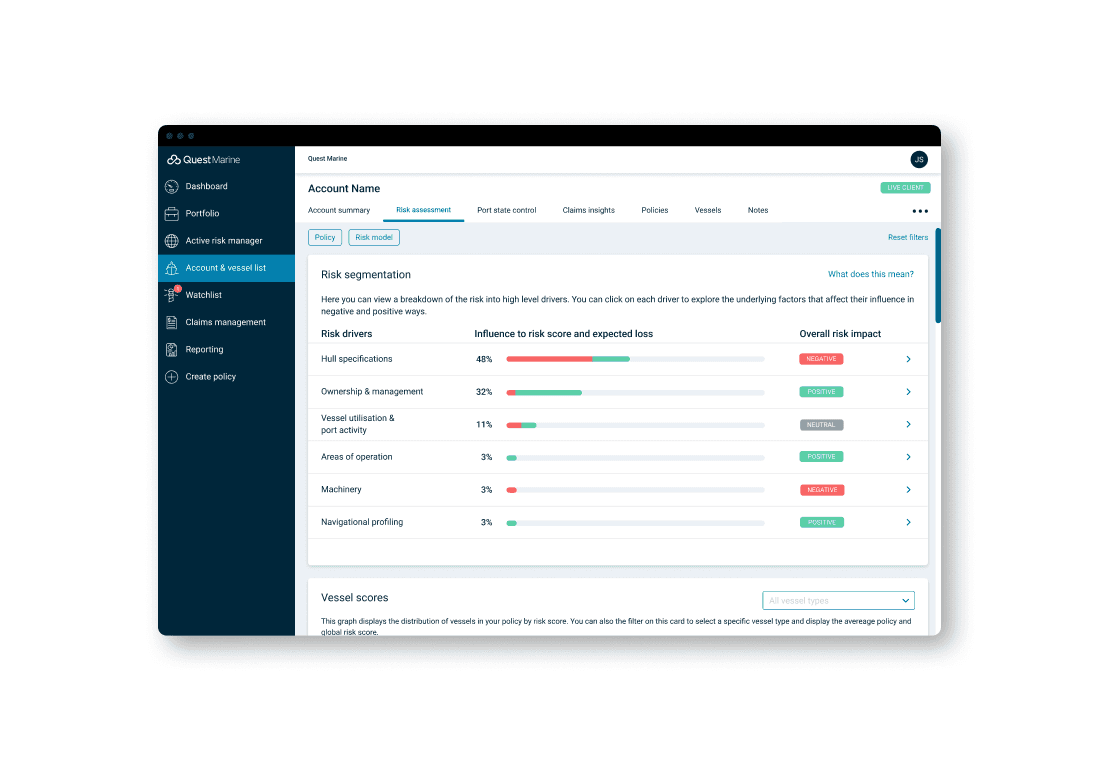
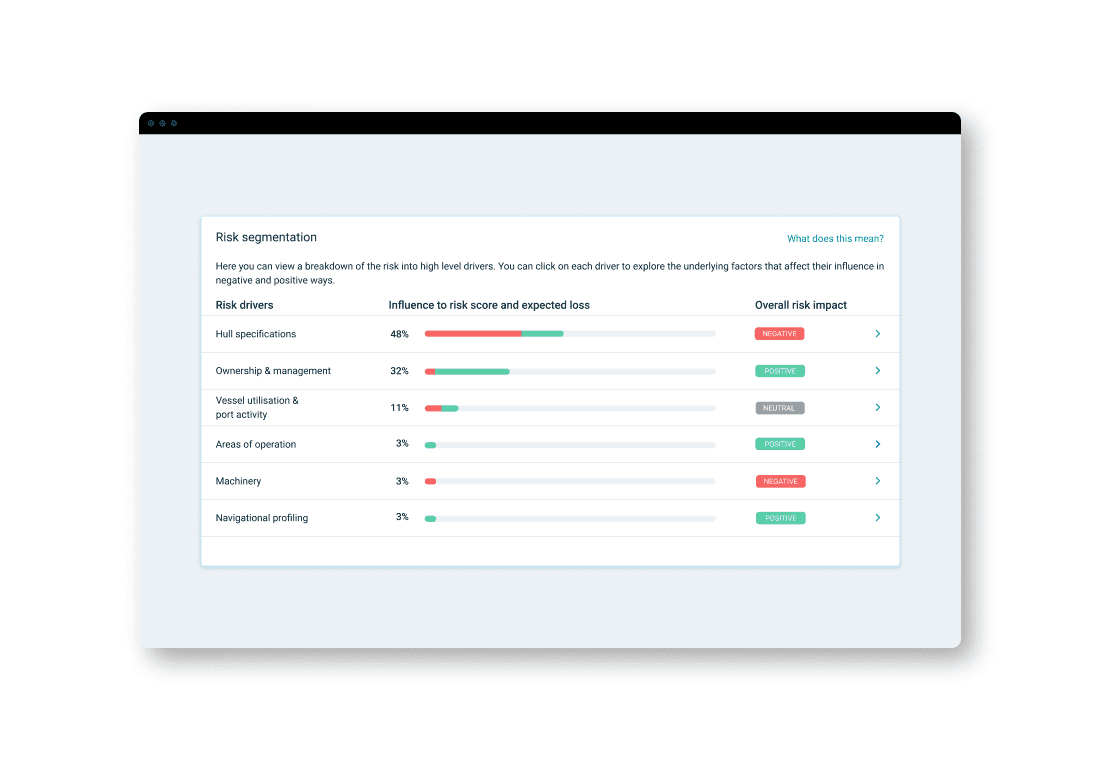
Client feedback from testing the mock-ups was instrumental in refining a solution that effectively presents key information. Our goal was to deliver a clear, high-level summary of risk drivers while maintaining simplicity to help users quickly identify trends and themes.
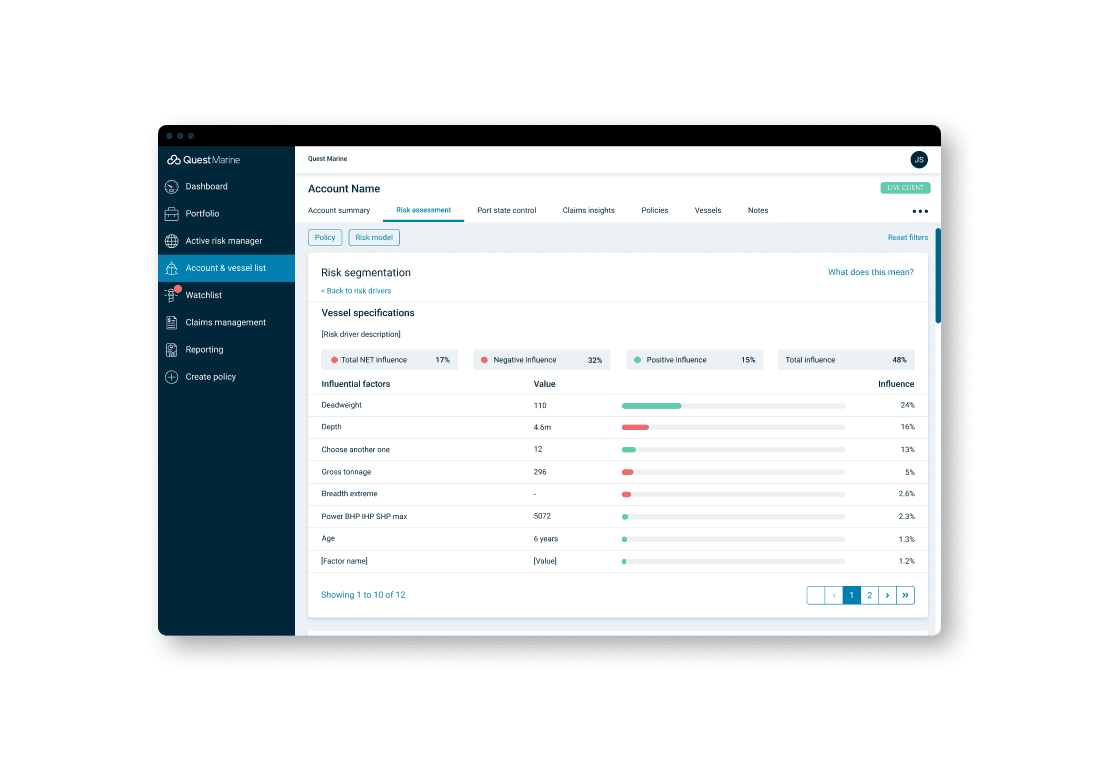
While we prioritized simplicity, it was also important to retain access to detailed data. To achieve this, individual factors were grouped under their corresponding risk drivers, allowing users to drill down and assess which factors were influencing each driver, and ultimately, the overall risk score.
Outcome
Collaborating closely with clients throughout this project was instrumental in giving us confidence in the feature’s value even before development began. Upon release, the enhancement was well received not only by underwriters but also by other key personas, including P&I clubs and brokers. Users noted that the updated risk drivers provided a clearer narrative and, along with improved tooltips and descriptions, increased their trust in our risk assessment.
23% increased feature
engagement
We also tracked feature impact using Pendo and observed a notable increase in engagement with the risk assessment page post-release. For context, the previous and updated designs are included below.
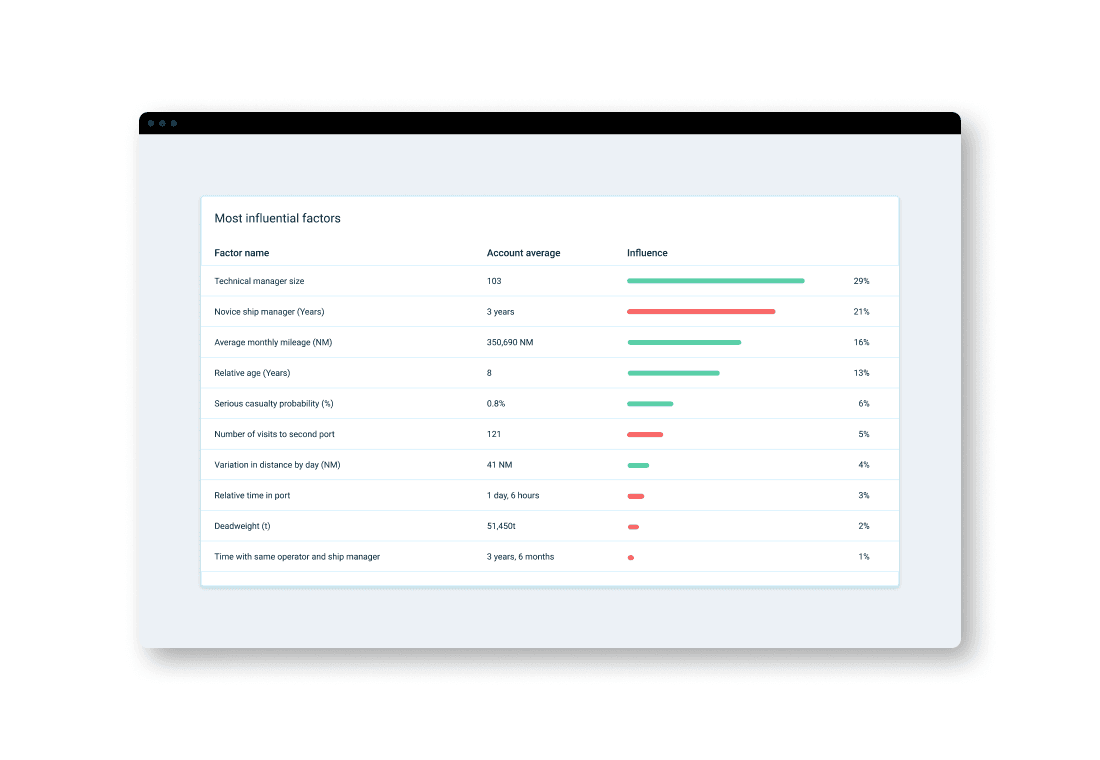
Before
After